It is becoming more commonplace in the United States to see electric vehicles (EVs) on the road alongside cars and trucks with traditional internal-combustion engines. Where you are in the country can make a difference in how many EVs you’re seeing, because adoption rates vary widely.
What is driving those differences? To oversimplify: incentives. Data is emerging that lets us dive a little deeper into the explanations.
The Federal Factor
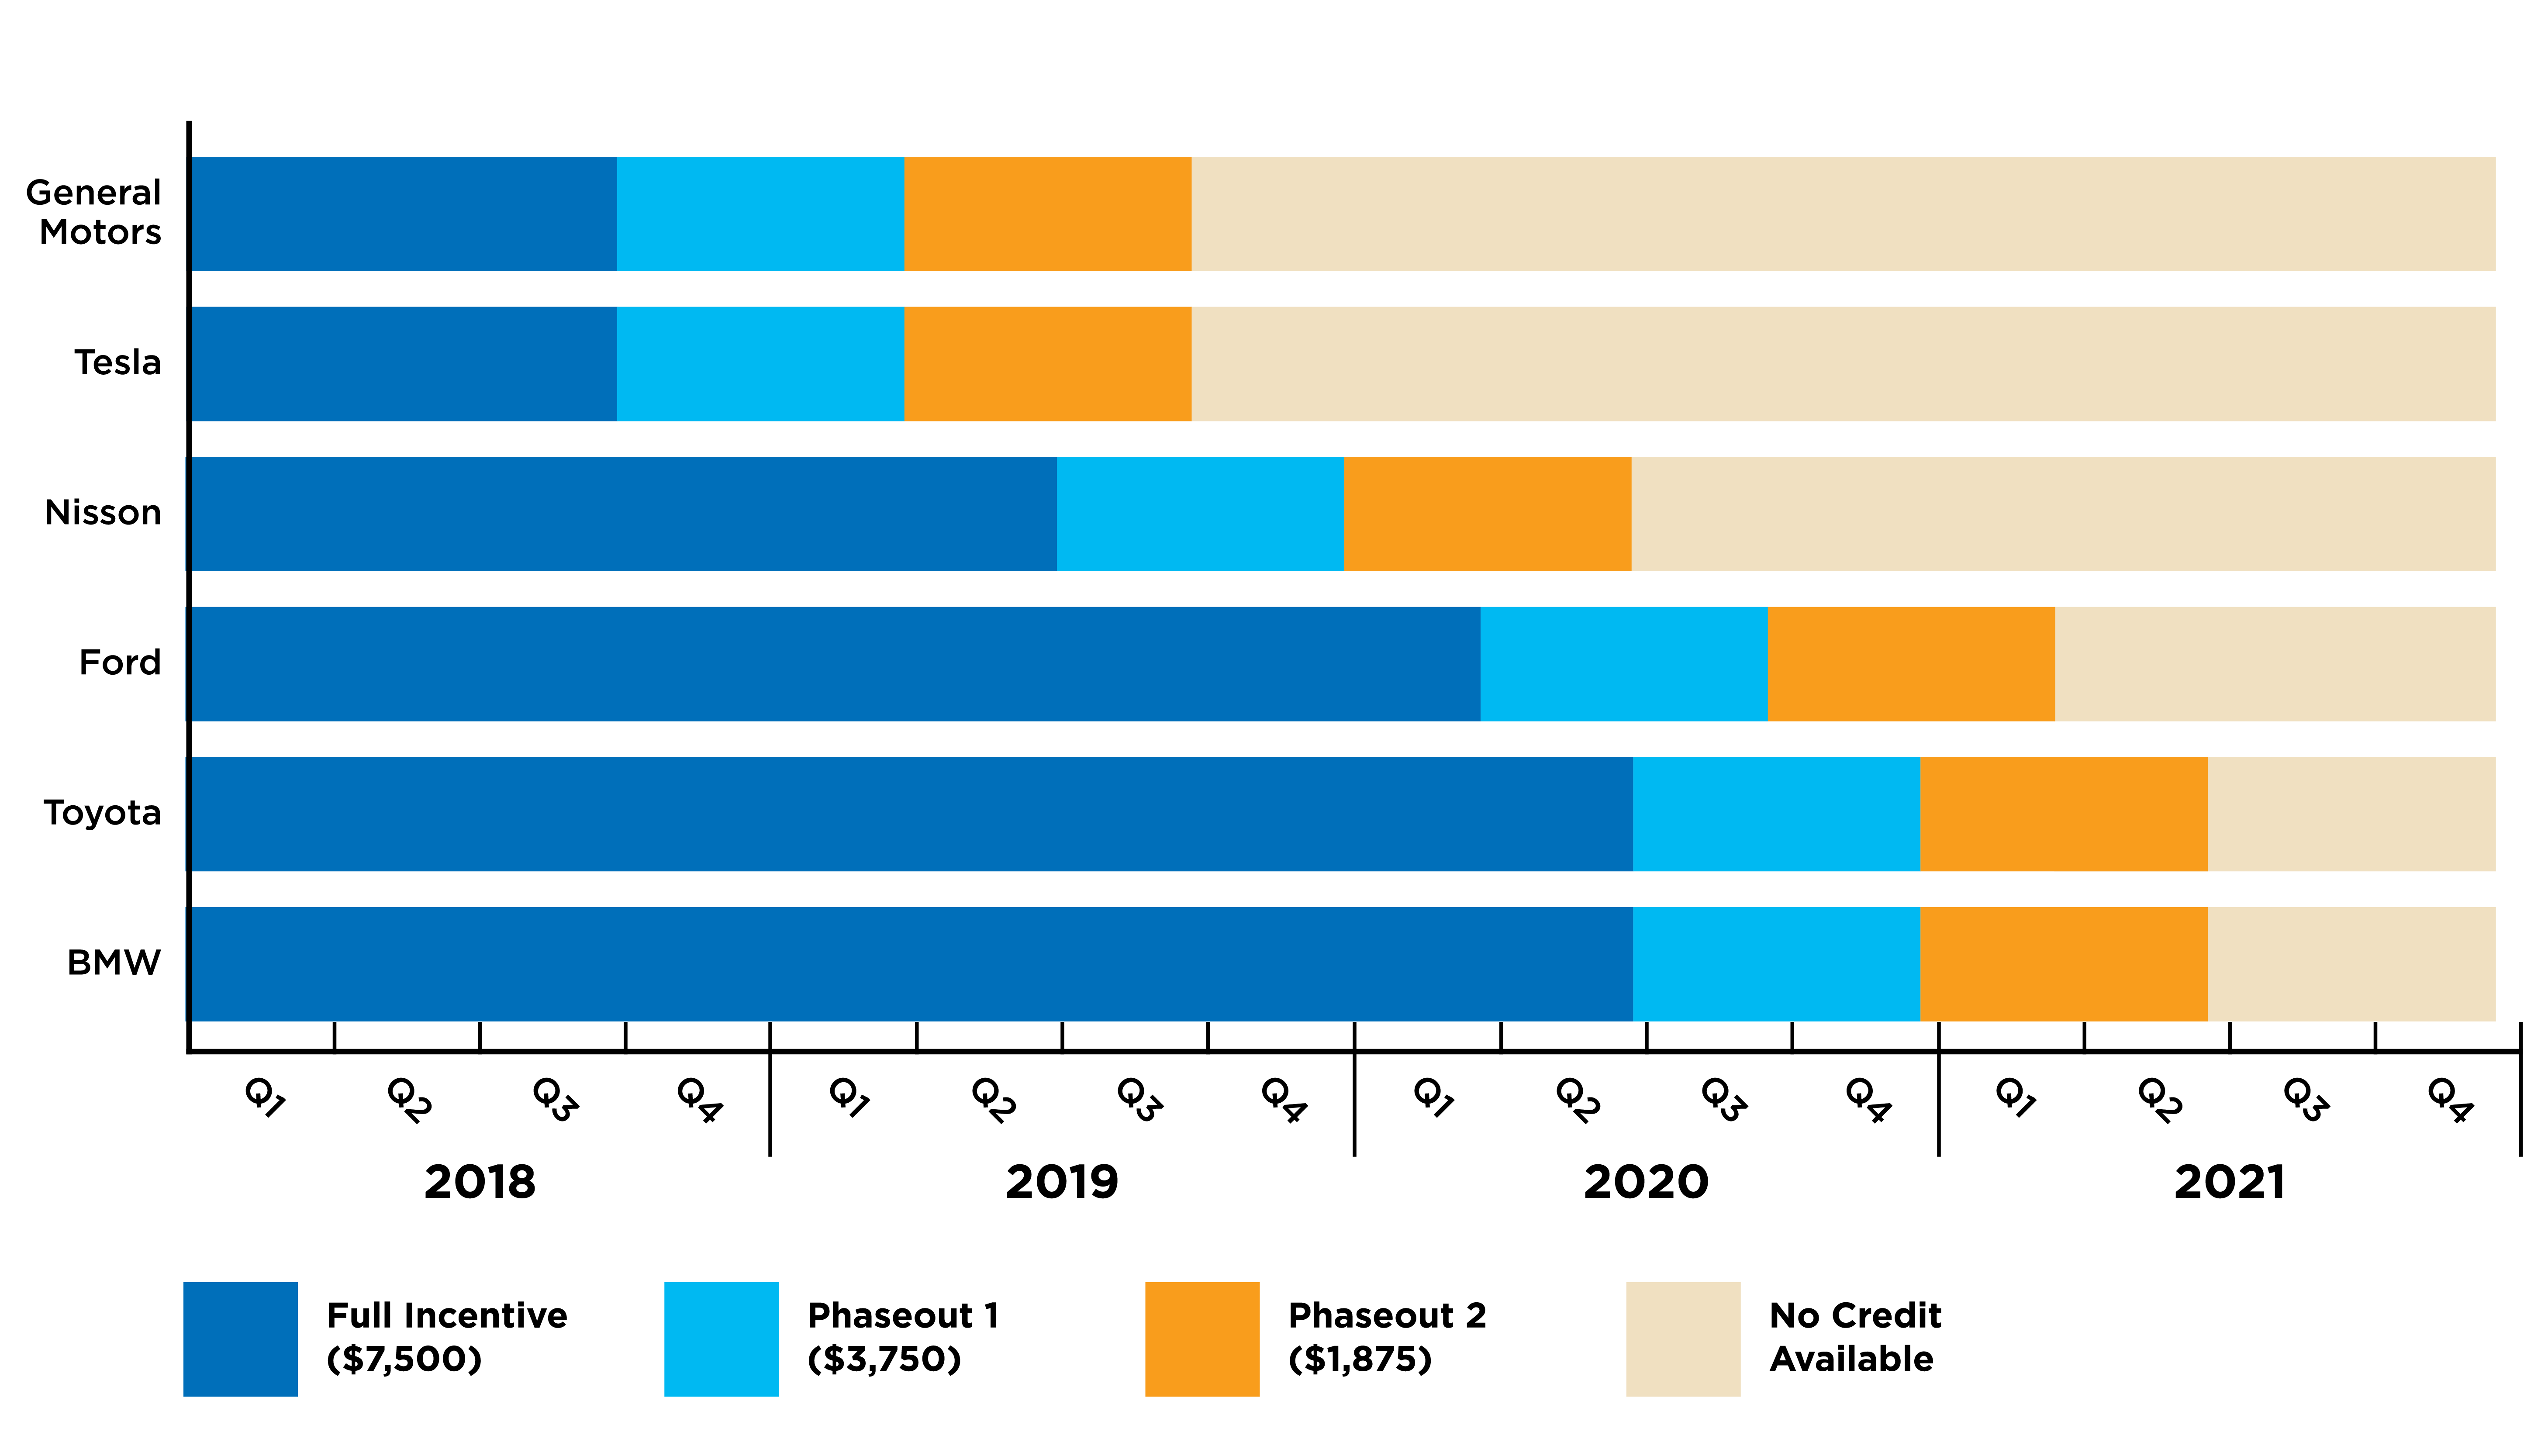
The U.S. government offers a federal tax credit of $7,500 — not just a deduction — for the purchase of a plug-in electric vehicle (PEV) that meets a minimum threshold for its battery pack capacity. Those credits are limited to 200,000 per manufacturer. Once that sales threshold is crossed, the incentive goes into a phaseout: one quarter of half the credit, followed by another quarter at 25% before phasing out completely.
 Source: ZEV Task Force’s “Multi-State ZEV Action Plan: 2018-2021”
Different adoption rates across vehicles have affected when the credits phase out. Tesla and Chevrolet became the first two companies to cross the threshold, thanks in large part to the popularity of the Tesla Model 3 and the Chevy Volt. Nissan appears to be the next manufacturer likely to do so; its Leaf has been around for a while but has not seen as many sales.
If the federal tax credit were the primary explanation for EV adoption, one would expect a fairly uniform adoption curve across the country. But differing adoption rates show much more dramatic variation, suggesting the flat federal incentive is only part of the story and that state-level incentives also have some influence.
Closer to Home
Different states offer an assortment of incentives. These can include anything from tax breaks, cash rebates and sales tax exemptions to high-occupancy vehicle (HOV) lane access. Some states offer free parking or might pay for the installation of an in-house charger.
While states within regions tend to adopt similar incentives, the exceptions and outliers in terms of adoption rates for states within a region help establish the impact of those more localized incentives. Some examples of outliers:
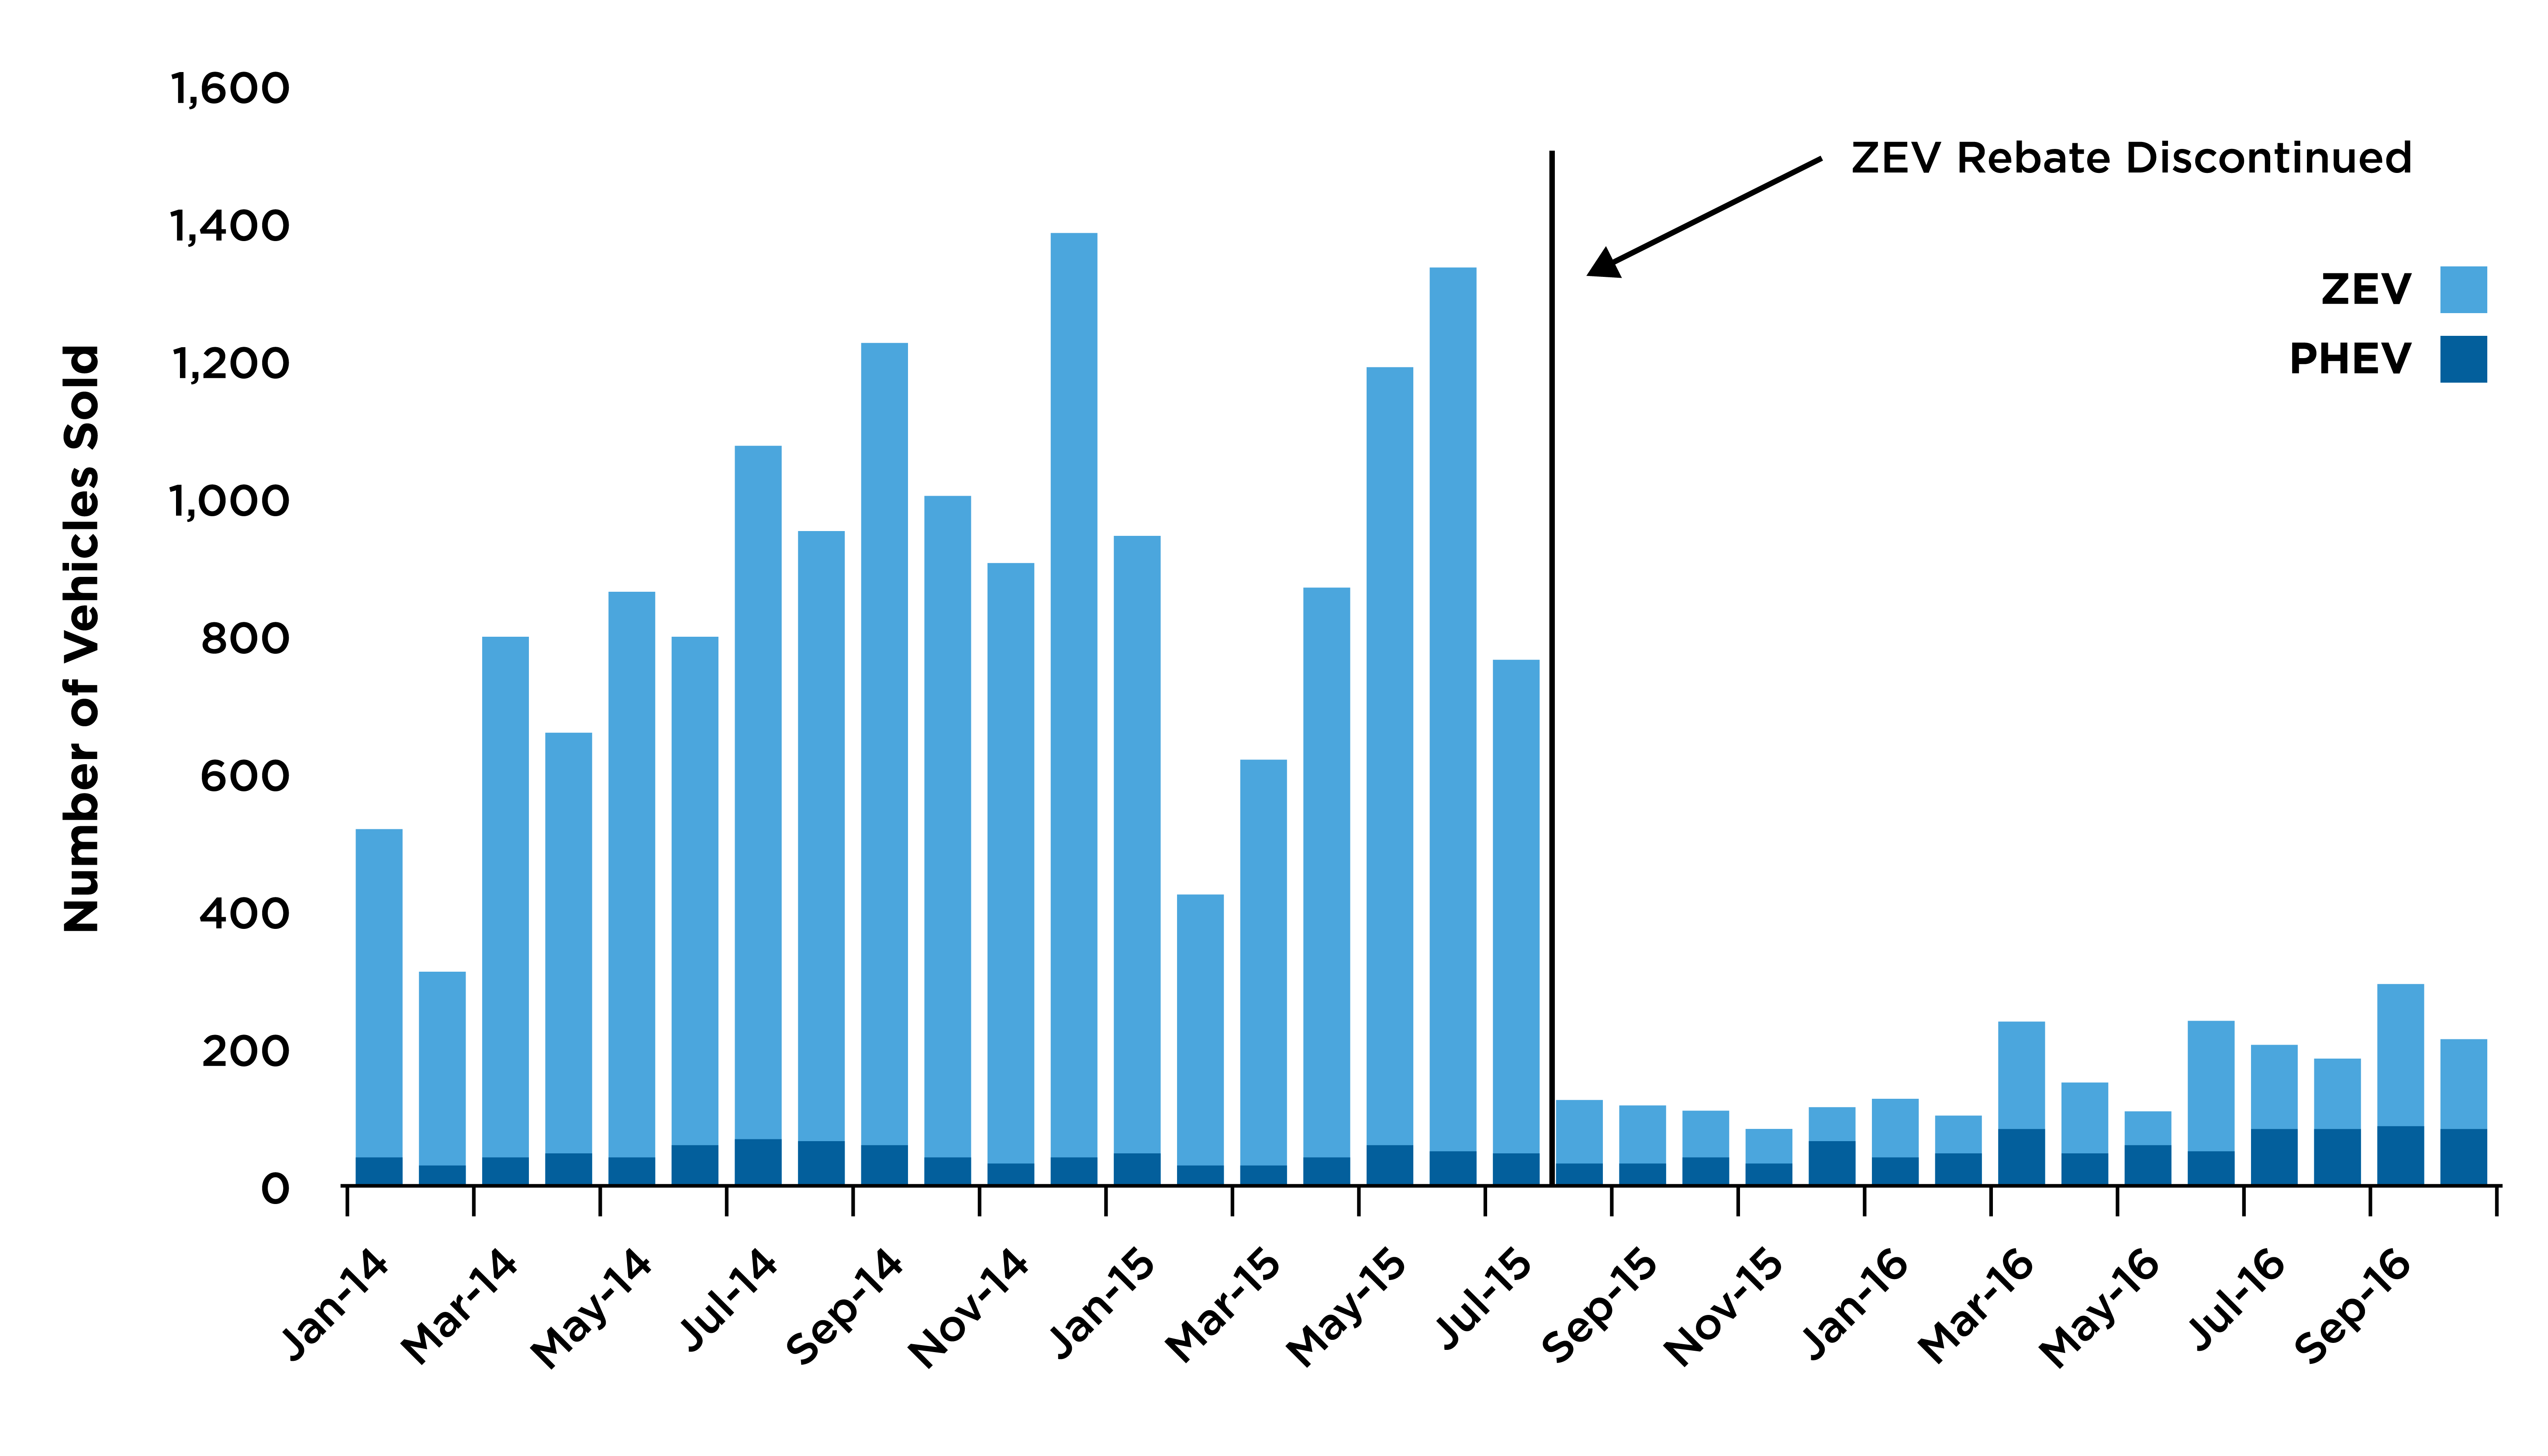
- Large incentives in the Atlanta metro area helped push Georgia’s adoption rate higher than its neighbors. However, when those incentives reached a predetermined roll-off in 2015, the number of EVs purchased dropped dramatically.
Source: U.S. Energy Information Administration
- Colorado recently introduced a $6,000 tax credit, which in combination with the federal tax credit makes a serious dent in the cost of an EV. That appears to be leading to an acceleration in EV purchases, as compared to neighboring states.
- Hawaii is a different kind of outlier, with higher adoption rates despite having lower incentives. This is likely related to local market factors like higher gas prices (due to importing fuel) and less range anxiety (due to smaller land area).
It is hard to detect patterns or alignment in the incentives from one state to the next. The closest thing might be the 10 states belonging to the Multi-State ZEV Task Force, a compact to coordinate action to encourage adoption of zero-emission vehicles and thereby reduce air pollution. Even within this group, however, the task force encourages each state to apply remedies fitting its market.
Matching the incentives to the market is as much art as science. In states with significant traffic congestion like California or Maryland, the HOV access can be enticing. In a place like New York City, the home charger incentive might be less effective because so few owners will have a home parking spot. What kind of cash rebates or sales tax exemptions can gain legislative approval will vary based on local politics.
The incentives landscape is constantly changing, as some credits and benefits are introduced while others begin to phase out or expire. In a country as spread out and with as much diversity in geography and markets as the United States has, local and regional approaches appear to have a much stronger correlation with increasing adoption of electric vehicles than national incentives. But one consistent thing that emerges from the data over time is a general trend of decreasing adoption rates in response to decreasing incentives.
As the number of electric vehicles on U.S. roads increases exponentially, utilities need to understand the full effects of EV charging on long-term peak demand.